
8 posts tagged with "performance"

View All Tags

Draco Mesh Compression Arrives in the PlayCanvas Editor

· 2 min read

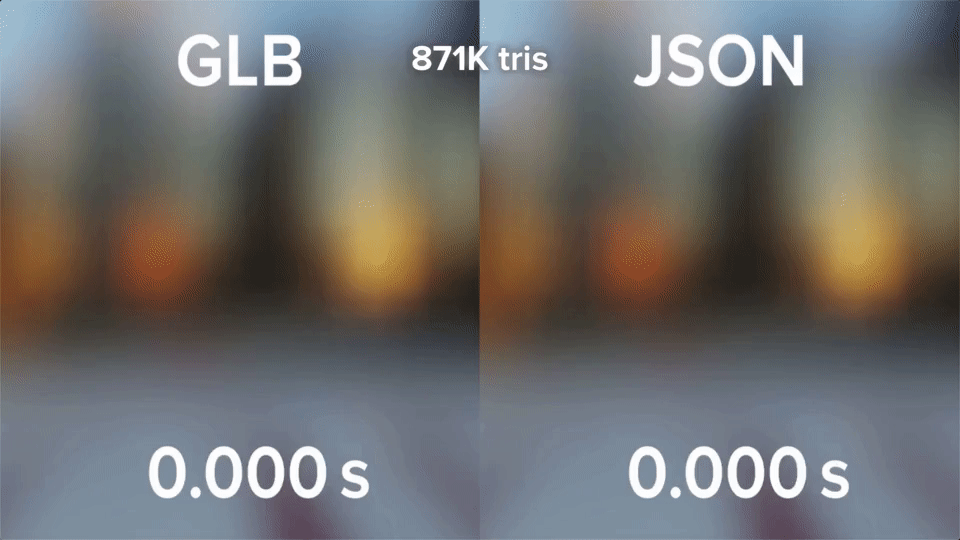
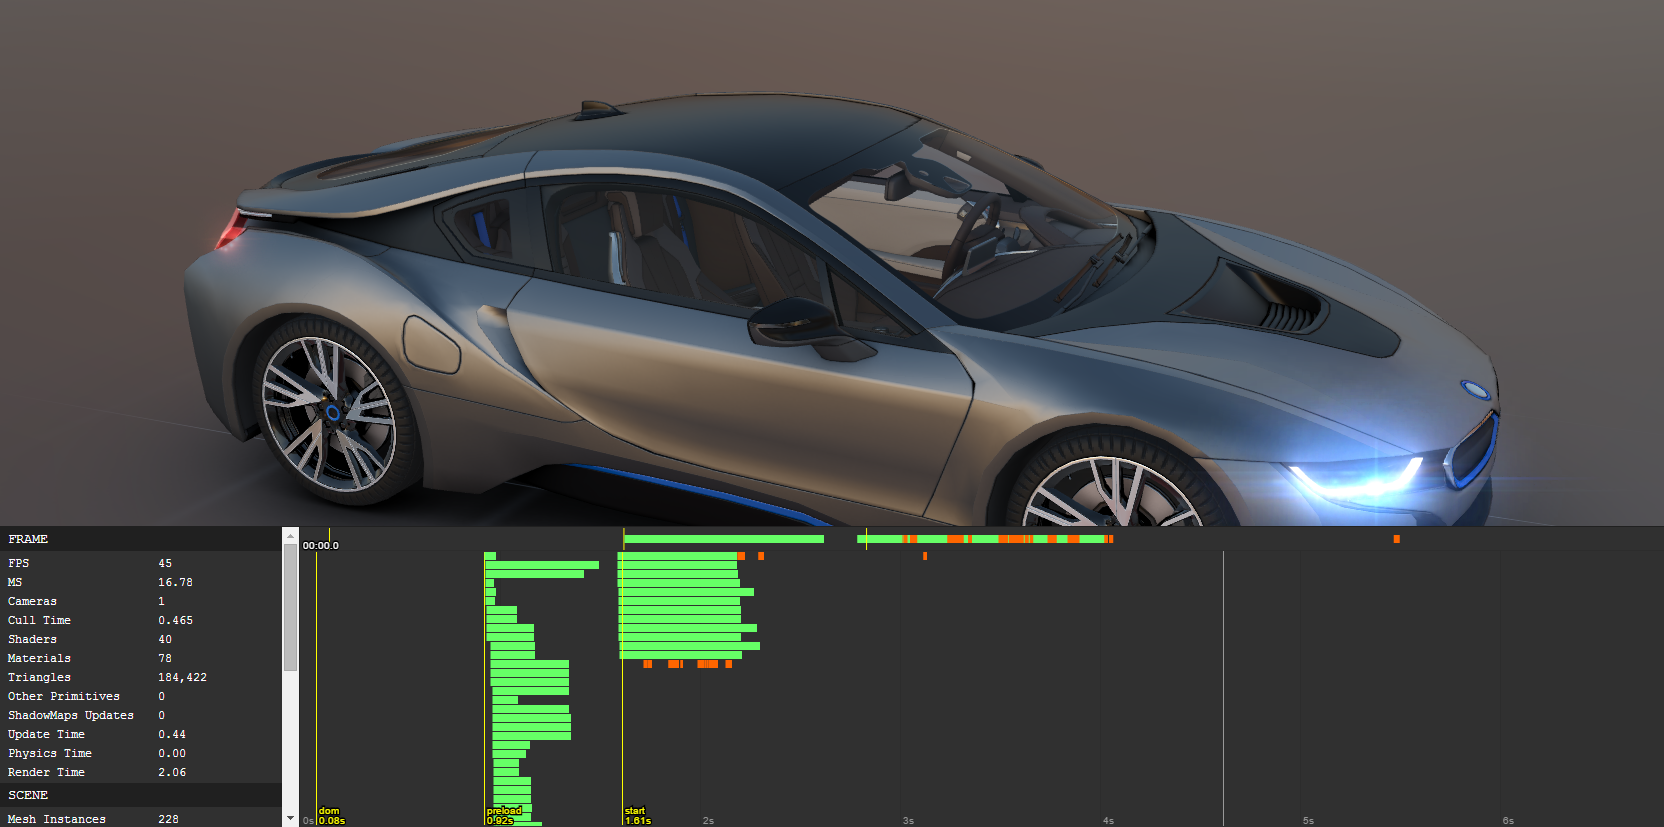
We are thrilled to announce the immediate availability of Draco Mesh Compression in the PlayCanvas Editor! Our latest feature allows developers to compress meshes using Google's Draco technology, reducing file sizes and enhancing the end-user experience.

At its core, Draco Mesh Compression reduces the amount of data needed to represent 3D graphics without compromising visual quality. The technology achieves this by applying a lossy compression algorithm to the mesh data. With less data to transfer, the result is faster load times and lower bandwidth costs for your applications.

The open source PlayCanvas Engine has been able to load Draco-compressed glTF 2.0 files for quite some time now. But now you can generate these Draco-compressed glTF files in the Editor at import time. Check out how easy it is to use:

"1972 Datsun 240k GT" by Karol Miklas is licensed under Creative Commons Attribution-ShareAlike.

In the example above, a 49.9MB GLB file is crunched down to only 3.67MB. That's a 92.6% reduction is file size! And for the majority of scenes, you should notice no difference in terms of visual quality. The only cost is decompression time when the compressed GLB is downloaded by an end user, but this should be significantly less than what is saved in terms of download time.

To enable the feature, open your Project Settings in the Inspector, expand the Asset Tasks panel and edit the Mesh Compression setting. Then, simply Re-Import any existing FBX or GLB and compression will be applied. Any FBX or GLB subsequently imported will also respect your mesh compression setting. Read more on the Developer Site.

We believe that mesh compression is going to take many types of applications to the next level, particularly e-commerce applications like product configurators, which need to load detailed meshes as fast as possible.

Get started with PlayCanvas today and make your WebGL dreams a reality!

WebGL Case Study: Rebuilding the Star-Lord PBR Demo

· 4 min read

Way back in 2014, PlayCanvas was the first WebGL Engine to integrate PBR (Physically Based Rendering). To mark the event, we built the Star-Lord tech demo:

In the intervening 6 or so years, PlayCanvas has moved on dramatically. So we decided to leverage all of the latest engine features and republish it.

The most significant improvements are related to load time. Let's start out by comparing some key stats:

Star-Lord 2014Star-Lord 2021% Change
HTTP Requests22039↓ 82.3%
Preload Transfer (MB)10.15.6↓ 44.6%
Total Transfer (MB)13.79.9↓ 27.7%
Total Resources (MB)26.012.1↓ 53.5%
Load Time (s) *1.81.2↓ 33.3%

* Cache disabled on 100Gbps connection

Those are some pretty significant wins! So what are the differences between the two builds of the demo? Let's step through them one by one.

Convert JSON Meshes to GLB

In October 2020, PlayCanvas officially switched from JSON to glTF 2.0 (GLB) for storing all model and animation data. While gzipped GLB is reasonably similar in size to gzipped JSON, it is up to an order of magnitude faster to parse a GLB file once it has been downloaded. Plus, a GLB file occupies less system memory than the equivalent JSON file. Converting all of the assets from JSON to GLB is a simple process. First, flip the project setting 'Convert to GLB' in the 'Asset Tasks' group to true:

Convert to GLB

Now, simply reupload all FBX files and a .glb asset will be generated rather than a .json asset. The last step is to use the Replace command in the right-click context menu to replace the .json asset with the .glb asset (plus any materials as well).

Switch from JSON to GLB

You can then delete the old JSON asset (plus any unreferenced related materials).

Basis Compress Textures

Last month, we announced the integration of Basis texture compression into the Editor. Star-Lord was originally configured to use DXT, PVR and ETC compressed textures. A download size comparison is as follows:

Texture FormatDownload Size (MB)
DXT7.56
PVR6.09
ETC17.18
Basis2.38

This explains much of the download savings in the updated version.

Fortunately, applying Basis compression to the app's textures is literally a two-click operation:

Compress Basis

Prefilter Cubemaps in the Editor

When PBR first arrived in PlayCanvas, the Editor could not prefilter cubemaps. This conversion had to be performed externally with RGBM format cubemap faces being added to the Editor:

Cubemap Faces

Each cubemap had 6 mip levels with 6 faces for each level. And with 5 different cubemaps, that meant 180 of the demo's 220 HTTP requests were for these PNGs!

These days, the Editor makes is super easy to import 6 HDR cubemap faces, build a cubemap and then prefilter it.

Prefilter Cubemap

So instead of loading 180 PNGs, the demo now loads just 5 DDS files. Much faster. 🚀

Asynchronously Load Assets

To achieve an optimal load time, it is important to only load what is required to make your app functional. It is arguable that music is not strictly a necessary precondition for your app to start. Therefore, the demo now asynchronously loads the mp3 asset that contains the music track and auto-plays it as soon as it is downloaded. It is 3.9MB which accounts for nearly 40% of the app's payload! So be sure to carefully audit your app for assets that can be streamed instead of preloaded.

Read more about preloading and streaming of assets in the User Manual.

Basis Texture Compression arrives in PlayCanvas

· 3 min read
Steven Yau
Partner Relations Manager

PlayCanvas implemented the fantastic hardware texture compression workflow in 2016 which allowed users to build bigger and better WebGL apps, even on low memory devices like mobile phones.

JPGs and PNGs are great formats for transmission over a network because they tend to compress nicely. But once the images are downloaded and handed over to WebGL, they must decompressed to raw RGB(A) data. Using hardware compressed textures is important as decompression is performed in silicon on the GPU which avoids the need to utilize lots of memory.

This 4096 x 2048 Earth texture is a 1.81MB JPG but takes a huge 33.6MB of VRAM when uncompressed!

Earth Texture

With hardware supported texture formats, we can retain a similar file size while massively reducing the amount of VRAM as seen below.

Legacy Texture Compression

Now, what if you reduce file sizes as well as the VRAM usage?!

That is what Basis gives us and it is available right now to all PlayCanvas users! Compressing the same Earth texture above, produces a 521KB Basis Texture.That’s a 68% saving over the smallest file size from the hardware supported formats 💪

Basis Texture Compression

Basis is an open sourced, texture codec that produces a highly compressed intermediate file format (.basis) that can be converted at runtime to a format that the hardware supports in GPU hardware. This means that there is only a single (and often smaller) file that is created to support a wide range of platforms.

As shown by the numbers above, Basis offers huge savings in download times for the end user which in turn, can lead to improved user engagement and click to open metrics for your application.

Let’s check out a real world example. The Space Base Texture Compression Demo from our previous blog article achieves the following VRAM usage and download sizes (gzipped) on desktop in Chrome:

Texture Compression Comparison

Texture VRAM Usage

Note that VRAM usage for Basis would ordinarily be the same as with legacy compression. However, PlayCanvas compresses normal maps to YYYX format instead of XYZ for improved quality so utilization is marginally higher.

Texture Download Size

That’s a big saving of 52% (19.5 MB) in download size from updating the project to use Basis while using a similar amount of VRAM!

And all it takes is a couple of clicks in the asset inspector to get started with Basis compression!

Enable Basis

To Recap

  • Only need one compressed file vs many (DXT, PVR, ETC1, ETC2, etc) for every texture
  • Up to 2.8 times smaller files and faster download times for your users
  • Up to 10x faster compression times with Basis
  • Similar savings in VRAM usage as hardware supported formats
  • Same one click process to compress textures

Basis texture compression is available to everyone right now so start crunching down those textures! More information can be found in the documentation including a migration guide.

And if you’re new to PlayCanvas, why not sign up today. We can’t wait to see what you make! Let us hear your feedback in the forums!

Faster Load Times with glTF's GLB Format!

· 2 min read
Steven Yau
Partner Relations Manager

The PlayCanvas team is super excited to announce the Editor support of glTF GLB conversion with model and animation imports.

This gives developers an order of magnitude reduction in load times compared to the JSON format while keeping similar gzipped download size.

JSON vs GLB

Using the Stanford Dragon model (2,613,679 vertices, 871,414 triangles), we can compare GLB and JSON parse times on a Macbook Pro 16 inch.

The JSON format took over 3 secs just to parse the data, a peak memory usage of ~498 MB and a gzipped package size of 28.1MB.

JSON Load Time

GLB speeds ahead taking only 0.193 secs which is 17x faster, uses a peak of ~25.2 MB of memory and a gzipped package size of 25.7MB! 🚀

GLB Load Time

That’s a huge saving in time and means applications will become snappier and more responsive to users, especially for content heavy games and product showcases.

We will be deprecating the use of JSON and the default format that model and animations files. Newly created projects will default to converting to GLB and in existing projects, this can be enabled in the projects settings:

Convert to GLB

If you would like to replace your current JSON assets with GLB, the User Manual has more information about the process to migrate over.

The conversion to GLB supports the importing of multiple animations in a single FBX which will help improve content workflows.

Import Multiple Animations

Remember our awesome glTF 2.0 Viewer? That is now integrated into the Editor to inspect any GLB asset from the project. Just right and select ‘Open In Viewer’!

Open In Viewer

Also, we have exposed Animation Import Settings under Asset Tasks in project settings. These will allow developers to adjust a balance between animation quality and fidelity against file size.

Animation Import Settings

Our next steps are to add support for viewing and editing a model hierarchy in the Editor which will lead onto support for the importing of GLB files.

The team is hard at work designing and implementing these features so watch this space!

WebGL Texture Compression Made Easy

· 3 min read

Big news! PlayCanvas is excited to introduce easy texture compression, enabling you to build bigger and better WebGL apps.

Today, the vast majority of WebGL developers load textures from JPG and PNG images. Unfortunately, while these formats compress well for transmission (especially JPG), they occupy a great deal of video memory when passed to WebGL. For example, let's consider this image of the Earth:

Earth Texture

The image is 4096 by 2048 but compresses well to a 1.81MB JPG file. Under the hood, WebGL expands this image to uncompressed 24-bit RGB, using 33.6MB of VRAM! Now imagine a single material with diffuse, normal, metalness, gloss, emissive and opacity maps. 6 of these images will occupy over 200MB of VRAM. Now imagine having 10 or more unique materials in your app. Get ready for crashed browser tabs and unhappy end users!

WebGL solves this problem by providing support for a number of compressed texture formats supported in hardware on the GPU. Each GPU tends to support at least one of these formats. Today, WebGL has fairly widespread support for:

  • DXT: supported by all desktop devices and some Android devices
  • PVR: supported by all iOS devices and some Android devices
  • ETC1: supported by most Android devices

PlayCanvas exposes these formats through a simple inspector panel on a texture asset. For the Earth image, it gives the following results:

compressiondialog

The first number is the GZIPed file size and the second number denotes how much VRAM is occupied by the texture. Notice how the compressed images occupy one sixth of the VRAM when compared to the original JPG. This is a stunning reduction!

Let's turn out attention to the demo iframed at the top of this article. VRAM usage is as follows:

Texture SetVRAM Usage (MB)
JPG + PNG528.0
DXT87.7
PVR66.8
ETC187.7

Texture compression suddenly makes the demo mobile friendly. But notice how it loads incredibly quickly after loading a mere 4MB of data. How is this possible? The textures are using a technique called level of detail, where low resolution versions are loaded up front allowing the application to start, while the high resolution versions asynchronously stream in the background. Also note that the app doesn't have to load any lightmaps because they are created procedurally on application start using PlayCanvas' runtime lightmap generation.

PlayCanvas' approach ensures that the most optimal texture format is selected for the device on which your application is running. In contrast, the Unity WebGL solution loads DDS files and decompresses as necessary on platforms that don't support it. This means that mobile devices do not benefit despite mobile devices having the greatest need for compression.

Summary

  • One-click texture compression for DXT, PVR and ETC1
  • Achieve at least 6 times compression of all texture data in your WebGL apps
  • Most optimal image format selected for device running a PlayCanvas app

PlayCanvas Texture Compression is available from today for Organization and Personal account holders (see the manual for more info). It will be rolled out to all users following a short beta period. So go forth, compress your textures and take your WebGL apps to a whole new level. And if you're new to PlayCanvas, why not sign up today. We can't wait to see what you make!

DIRECT LINK TO RUN FULLSCREEN

PlayCanvas versus Unreal WebGL

· 5 min read

Our previous article comparing PlayCanvas with Unity's WebGL exporter certainly got folks talking. One of the questions that came up in the aftermath was "OK, but what about Unreal's WebGL exporter?". Unreal, like Unity, relies on Emscripten to port the native codebase to JavaScript. So it would be reasonable to expect Unreal to suffer from the same issues as Unity: large download sizes, long load times and poor runtime performance.

We could do the same experiments as before with the textured cube, but let's try to make a more real-world comparison. Flappy Bird clones have been made in both Unreal and PlayCanvas. Let's take the Epic-authored Tappy Chicken and see how it fares against the PlayCanvas-powered Flappy Bird. Here's the  (playable) PlayCanvas game:

Unfortunately, I can't embed Tappy Chicken because Epic have restricted it to desktop browsers. So here's a link to it, along with an animated GIF:

tappychicken

So before we begin, there's an important point to make. They are not the same game and they do exhibit certain differences. Tappy Chicken uses different textures, has parallax, uses particles and so on. But in essence, they are remarkably similar and worthy of a comparison, despite not being pixel perfect clones of each other. It's up to you, dear reader, to decide if the differences in the games account for the results of the analysis presented below.

As before, we will look at three key metrics: download size, load time and runtime performance.

Download Size

To check the download size of each app, we disabled the cache in Chrome Dev Tools and recorded the total transfer:

Tappy Chicken (Unreal)Flappy Bird (PlayCanvas)
10.0MB0.22MB

Epic's game is over 47 times larger than the PlayCanvas game. Again, we see an Emscripten dependent engine struggle with download size. Just the JavaScript of Tappy Chicken accounts for 7.3MB of the entire 10MB payload, and that is the GZIPped size. Uncompressed, it is over 36MB of JavaScript. PlayCanvas' hand-written, 'JavaScript-first' approach wins out here, with a tiny 147KB footprint (615KB uncompressed) for the entire engine.

Load Time

Unfortunately, Epic prevents Tappy Chicken from running on mobile so we'll just test load times on desktop. For the test, we'll use a Core i7-powered Win10 machine on a 50Mb/s connection to the net. The browser cache has been disabled.

BrowserTappy Chicken (Unreal)Flappy Bird (PlayCanvas)
Chrome 5215.8s0.9s
Firefox 4811.0s1.4s
Edge 1423.6s1.1s

The PlayCanvas game was also run on a number of mobile devices and always runs at 60Hz and loaded in under 2 seconds.

Things to notice:

  • Chrome loads the PlayCanvas game 17.6 times faster than the Unreal game. Other browsers show impressive multiples too.
  • Firefox loads the asm.js-based Unreal runtime the fastest. Since Emscripten is a Mozilla technology and Firefox is heavily optimized for asm.js code, this is not a great surprise.
  • Load times appear to depend on more than just loading the game files. Preprocessing 36MB of JavaScript also contributes to the slow Unreal load times.

Runtime Performance

To analyze runtime performance, let's compare captures of the two games using the Timeline panel in Chrome Dev Tools. Here's a capture for the PlayCanvas-powered Flappy Bird showing a frame executed in 0.57ms:

flappy_timeline

And here's a capture for the Unreal-powered Tappy Chicken with a frame executed in 5.0ms:

tappy_timeline

In each capture, a typical frame has been selected. Not the fastest, not the slowest. Just an 'average' frame. Note that both captures are showing a frame at the same timeline scale.

Things to notice:

  • CPU load in the Unreal game is typically around 8x greater than for the PlayCanvas game. Taking the 'Composite Layers' step of the browser into account (green bar in the Timeline captures), the multiple is closer to 6x. So although both games generally lock to 60Hz on the test hardware, the PlayCanvas game can process a frame well within a millisecond whereas the Unreal game is clearly stressing the CPU. On lower end hardware, the Unreal game would become CPU bound.
  • CPU load is much more variable in the Unreal game and spikes regularly. Without understanding the internals of the Unreal engine, it is hard to explain this. But the result is sporadic frame drops.

Conclusion

To summarize:

  • Epic's game is over 47 times larger than the PlayCanvas game.
  • Chrome loads the PlayCanvas game 17.6 times faster than the Unreal game.
  • CPU load in the Unreal game is typically around 8x greater than for the PlayCanvas game.

To be fair, Epic say the following in their documentation:

The HTML5 pipeline is currently experimental. Some projects may not run properly when built for the HTML5 platform. Expect some rough edges.

But we clearly see here that Unreal suffers similar problems to Unity's WebGL exporter. Export sizes are huge, load times are long and runtime performance is poor when compared to a 'WebGL-first' engine like PlayCanvas.

To learn how PlayCanvas built an engine so optimized for the browser, head over to GitHub to explore the open sourced runtime. And if you want to start building with PlayCanvas today, sign up for free on playcanvas.com. To check out the Flappy Bird project, click here.

PlayCanvas versus Unity WebGL

· 6 min read

A question we get asked a lot is "How does PlayCanvas compare to Unity's WebGL export?". So let's examine this in a blog post.

But first, let me quickly introduce Unity and PlayCanvas to the uninitiated. Unity is a game engine provided as a native, desktop application for Windows, Mac and Linux. PlayCanvas is an HTML5/WebGL game engine that is provided as a web application that runs in any browser on any operating system.

For the purpose of this article, we're keeping things simple. We've created the 'Hello World' of apps in both Unity 5.3.2 and PlayCanvas: a spinning, textured cube:

The application above is the PlayCanvas app. I'm not embedding the Unity app since it can crash the page (if you're feeling brave, click here to run it in a new tab).

We decided to look at 3 key metrics: download size, load time and frame rate.

Download Size

To check the download size of each app, we disabled the cache in Chrome Dev Tools and recorded the total transfer:

UnityPlayCanvas
4.72MB0.22MB

The Unity app is over 21 times larger than the PlayCanvas app. How is this possible? The PlayCanvas engine is a miniscule 147KB when GZIPped meaning the code and assets for the app account for the remaining 73KB. The engine is so small because it is hand-crafted in JavaScript, relying on as much functionality as possible from the browser itself.

Unity, on the other hand, relies on Emscripten to export to WebGL. This tool auto-converts C# code to C++, which in turn is compiled to LLVM before finally being turned into JavaScript. A side effect of this process is the generation of huge amounts of code, which bloats the exported application, overwhelms modern JavaScript engines and often causes the browser to run out of memory.

Load Time

We ran both apps on 12 different devices, from low end to high end. These were the recorded load times on a 50Mb/s connection to the net:

DeviceBrowserUnity (s)PlayCanvas (s)
iPhone 4SSafariCrash2
iPhone 5SSafari181
iPhone 6Safari171
iPad Mini 2Safari211
Samsung Galaxy Tab S2Chrome 51191
Samsung Galaxy Note 10.1 2014Chrome 51281
Samsung Galaxy S6 EdgeChrome 51281
Samsung Galaxy Note 4Chrome 51281
LG Nexus 4Chrome 51442
Leapfrog EpicChrome 51431
Blackberry Z10Default BrowserCrash1
PC (Core i7 + GeForce GTX 880M)Chrome 51131

Key things to notice:

  • The PlayCanvas app's load times are up to 43 times faster than the Unity app.
  • The Unity app fails to even load on lower end devices. The sheer amount of JavaScript causes the browser on those devices to run out of memory loading the page.
  • Load times for Unity are up to twice as slow in Chrome as Safari. This could be down to Chrome spending more time preparing the app's huge JavaScript codebase for execution.

Frame Rate

Here are the frame rates recorded for the same set of devices:

DeviceBrowserUnity (fps)PlayCanvas (fps)
iPhone 4SSafariCrash58
iPhone 5SSafari2160
iPhone 6Safari2860
iPad Mini 2Safari1660
Samsung Galaxy Tab S2Chrome 5117-5560
Samsung Galaxy Note 10.1 2014Chrome 5115-5060
Samsung Galaxy S6 EdgeChrome 5115-5060
Samsung Galaxy Note 4Chrome 5115-5760
LG Nexus 4Chrome 5115-5060
Leapfrog EpicChrome 5116-5560
Blackberry Z10Default BrowserCrash60
PC (Core i7 + GeForce GTX 880M)Chrome 5157-6060

Key things to notice:

  • PlayCanvas frame rates are up to 4 times greater than Unity. In particular, Unity seems to perform poorly in Safari on iOS.
  • Unity exhibits very unstable performance in Chrome for Android. Initially, the app's frame rate is in the mid to high teens for approximately 20 seconds before it starts to rise to a number in the 50s. At that point it, it regularly drops frames and never reaches a solid 60FPS.
  • PlayCanvas easily locks to 60FPS across all devices except iPhone 4S where an occasional frame is dropped. Ideally, a much heavier stress test would be required to start taxing PlayCanvas.

Conclusion

To summarize:

  • Unity WebGL apps are up to 21 times larger.
  • PlayCanvas apps load up to 43 times faster.
  • PlayCanvas app frame rates are up to 4 times higher.

Even for the most basic of 3D apps, Unity struggles to achieve anything close to acceptable download size, load time and frame rate. It's important not to somehow blame browser vendors or HTML5/WebGL for these results. As PlayCanvas proves, you can achieve incredible performance using these web technologies today as long as a sensible approach is taken when architecting an engine.

To learn how PlayCanvas built an engine so optimized for the browser, head over to GitHub to explore the open sourced runtime. And if you want to start building with PlayCanvas today, sign up on playcanvas.com.

Update

If you want to look at the original projects that built the two apps used in the article, here is the Unity project, and here is the PlayCanvas project. After publishing this article, we noticed that the Unity project disables hardware anti-aliasing and uses bilinear filtering on the textures, whereas PlayCanvas enables AA and trilinear on the textures. So PlayCanvas is actually doing more work here.

Performance Matters: Introducing the PlayCanvas Profiler

· 2 min read

Time to take the wraps off the latest awesome feature in PlayCanvas. We're super-excited to unveil the PlayCanvas Profiler.

profiler

The Profiler is a panel that overlays your app, displaying lots of useful timing information and performance stats. So whenever you're wondering why your app isn't hitting 60 frames per second, simply launch the Profiler and you should be able to figure out exactly what the problem is.

To launch the Profiler, there are new options available from the Launch button:

profiler_launch

Depending on whether your scripts are served from PlayCanvas or locally, select the relevant option that enables the Profiler. The Editor will remember the option you select for the next time you hit the Launch icon.

There is also a hot-key to toggle the Profiler: CTRL (CMD) + ALT + T.

Profiler Overview

profiler_stats

The left-hand panel of the Profiler displays statistics related to the currently rendered scene. It displays frame rate, the number of cameras enabled (normally, you will want this to be 1), the number of shaders, materials, triangles and so on. Also, frame time is broken down into update (the time to run all component updates), physics (simulation time) and render time (the time to pass all of the graphics commands to WebGL). At a glance, you can quickly see where there might be problems.

profiler_timeline

The right-hand panel is the Profiler Timeline. It displays a number of key events in your app's life from launch:

  • dom (DOM interactive):  event when the browser finishes parsing html document, and able to render first frame of a page to a screen
  • preload: event when PlayCanvas initiates preloading of all assets that are required before the app can start.
  • start: event when PlayCanvas begins the main application loop and rendering begins.

Green bars represent individual asynchronous asset loads. Orange bars are blocking shader compilations.

The Future's Bright

So we hope you enjoy using the new Profiler. But remember, true believers, more goodness is yet to come. This is our initial beta version but we have plenty of improvements coming down the pipe.

Any comments? Join the Forum thread.